Data analytics serves as a powerful catalyst for modern business growth by transforming raw, fragmented corporate data into a centralized source of strategic intelligence. By continuously monitoring operational metrics, supply chain performance, and financial workflows, a company can eliminate costly blind spots, optimize its cash flow cycles, and uncover hidden revenue opportunities—such as identifying near-miss thresholds for sales bonuses and vendor rebates. Furthermore, data analytics replaces guesswork with evidence-based predictive modeling, allowing executive teams to build highly accurate budgeting, forecasting, and customer relationship frameworks. Ultimately, this granular visibility empowers stakeholders across all departments to make faster, smarter business decisions that reduce technical debt, improve customer retention, and drive long-term organizational profitability.
Experience in BI tools and Platforms:

Data analytics
Data analytics is deployed to help customers review critical near-miss analytics for sales bonuses and rebates, as well as optimizing purchasing, sales, stock, and accounts payable and receivable tracking. By exposing margins and thresholds, these targeted analytics allow businesses to identify precisely where they might be falling short of volume incentives, preventing costly oversights in supply chain agreements. Furthermore, unifying tracking across stock levels, procurement pipelines, and cash flow cycles—such as aged payables and receivables—ensures that mid-market enterprises maintain optimal liquidity and inventory health without suffering from operational blind spots.

Financial Statements, Budgeting & Forecasting, Customer Relationship Management (CRM)
Central to executing these integration and modeling tasks is the seamless implementation and support of core business pillars, including Financial Statements, Budgeting & Forecasting, Customer Relationship Management (CRM) tracking, Rebates calculations, and general Analytics.
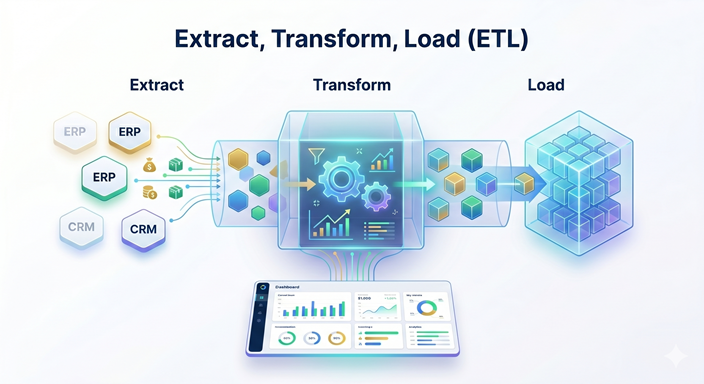
Data synchronisation
This architecture is powered directly by a specialized middleware suite engineered to securely extract, transform, and map disparate ERP data into unified analytical cubes. Whether syncing customer touchpoints from a CRM or feeding ledger transactions into a dynamic forecasting engine, these tools automate the background data pipelines, guaranteeing that the underlying repositories remain accurate, refreshed, and synchronized in real time.

Financial Planning and Analysis (FP&A), Rebate, and Budgeting
Ultimately, these combined capabilities make it possible to provide highly customized Financial Planning and Analysis (FP&A), Rebate, and Budgeting solutions tailored to the exact specifications of individual customers. Unlike rigid, one-size-fits-all reporting tools, these bespoke implementations adapt to complex vendor rebate structures, multi-currency corporate budgets, and specialized departmental workflows. By delivering tailored financial sheets and automated forecasting models, businesses can transition away from error-prone, static spreadsheets. Instead, they gain a dynamic, reliable, and holistic financial command center that drives sustained profitability and long-term organizational growth.
What people are saying
A critical dimension of analytics involves leading complex technical projects to implement new customers while continuously delivering fresh databases, software enhancements, and interactive dashboards to existing clients. The onboarding process requires designing scalable data models that align perfectly with a new customer’s unique infrastructure. For established clients, the focus shifts to optimization—deploying targeted system updates, refining data architectures, and building custom analytics dashboards that surface hidden operational trends. This dual commitment ensures that new implementations are built on solid, future-proof foundations, while long-term customers enjoy a continually evolving platform tailored to their growing business needs.

When evaluating the modern business intelligence landscape, organizations often find themselves choosing between specialized, industry-focused solutions and broad, enterprise-grade visualization giants. Platforms like Phocas Software excel by offering an all-in-one BI and FP&A ecosystem specifically tailored for mid-market manufacturing, distribution, and retail sectors. By delivering pre-built ERP integrations, native rebate management, and streamlined budgeting tools right out of the box, it removes the technical debt typically associated with data modeling. In stark contrast, legacy data visualization powerhouses like Tableau and Microsoft Power BI function as highly flexible, horizontal canvases. Tableau leverages its sophisticated VizQL engine to prioritize deep, exploratory visual analytics and ad-hoc data blending, making it a favorite for dedicated data scientists. Meanwhile, Microsoft Power BI dominates corporate environments through its tight integration with the Azure cloud and the Microsoft 365 suite, utilizing a multi-layered desktop-to-service architecture that democratizes reporting across all tiers of an enterprise at a highly competitive price point.
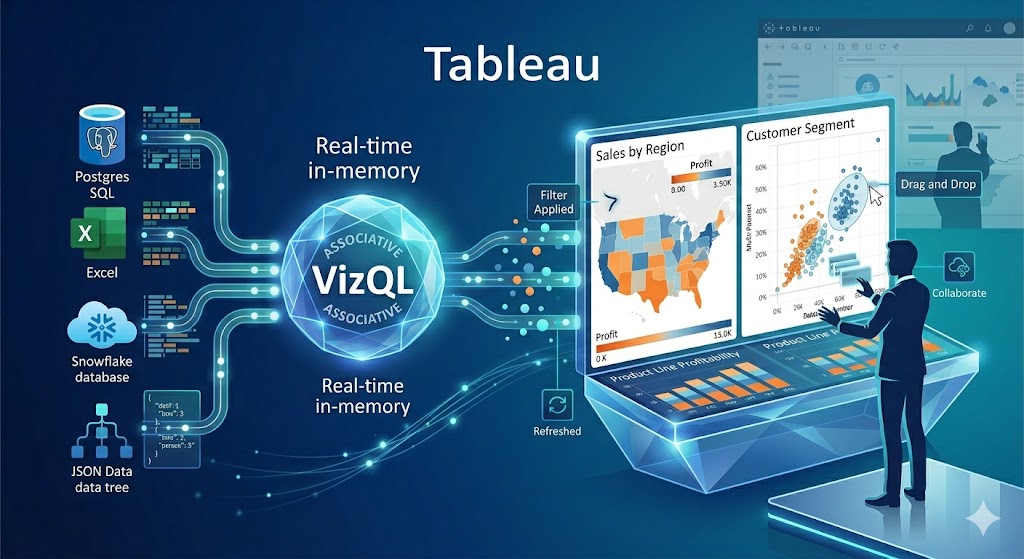
Tableau is a premier, highly interactive data visualization and business intelligence platform renowned for its ability to transform complex, unorganized data into intuitive, shareable dashboards without requiring heavy coding. Centered around its proprietary VizQL (Visual Query Language), Tableau translates drag-and-drop user actions into optimized database queries, allowing data analysts and business users alike to explore trends, spot anomalies, and perform ad-hoc analyses in real time. The ecosystem scales fluidly from Tableau Desktop for deep data blending and dashboard authoring, to Tableau Server and Tableau Cloud for secure, enterprise-wide collaboration and automated refreshes. By prioritizing visual cognitive processing over static tabular reporting, Tableau democratizes data exploration, enabling organizations to swiftly uncover actionable insights and foster a truly data-driven corporate culture.
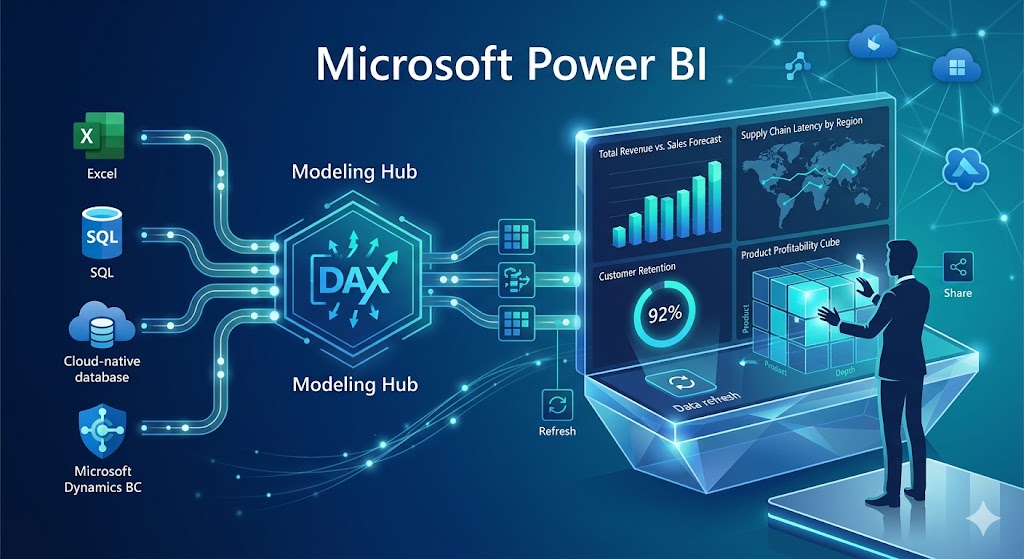
Microsoft Power BI is an industry-leading, cloud-based business intelligence platform designed to convert fragmented, multi-source data into cohesive, visually immersive, and interactive insights. By offering seamless native connectivity to a massive array of data ecosystems—ranging from simple Excel spreadsheets to complex enterprise architectures like Microsoft Dynamics Business Central, SQL databases, and external cloud platforms—Power BI eliminates traditional information silos. The platform utilizes a robust, two-phase framework: Power BI Desktop for heavy data ingestion, complex modeling via DAX (Data Analysis Expressions), and report authoring; and the Power BI Service for secure, cloud-based dashboard sharing and automated data refreshes. Ultimately, by embedding real-time analytics and self-service data exploration directly into daily workflows, Power BI democratizes corporate data, empowering stakeholders at all organizational levels to confidently make evidence-based, strategic decisions.
Google Looker
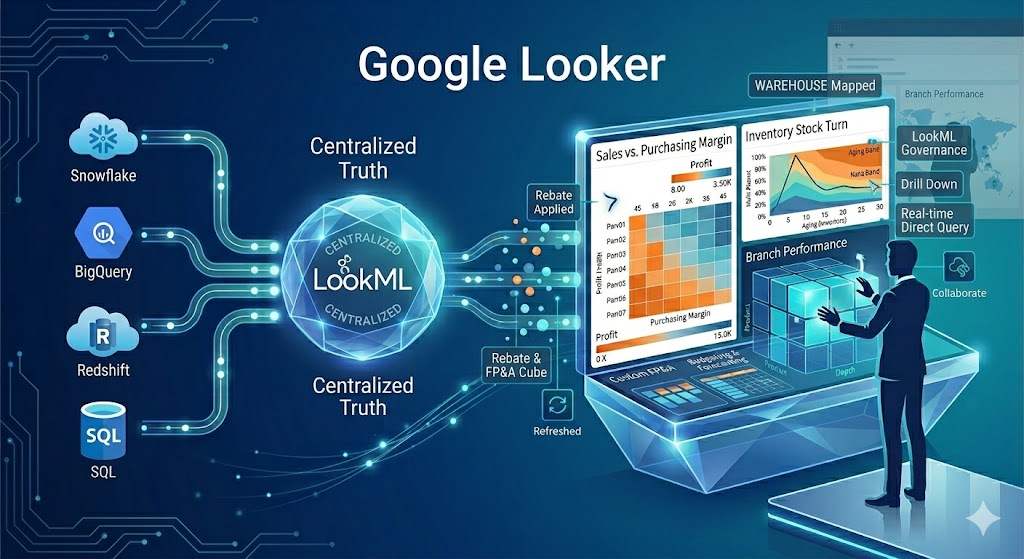
Google Looker is a modern, enterprise-grade business intelligence and data analytics platform that distinguishes itself through a centralized, code-governed approach to data modeling. Unlike traditional BI tools that require separate data extracts, Looker operates directly against modern cloud data warehouses using its proprietary modeling language, LookML (Looker Modeling Language). This unique architecture allows data teams to define business metrics, relationships, and security protocols in a single, reusable layer, ensuring that every user across an organization accesses a “single source of truth” without discrepancies. The platform seamlessly combines this robust data governance with intuitive, self-service exploration, interactive dashboards, and data-driven webhooks that can trigger automated workflows in external applications. By shifting the focus from static reporting to real-time, governed data experiences, Looker empowers companies to embed reliable analytics directly into their daily operations and customer-facing products.
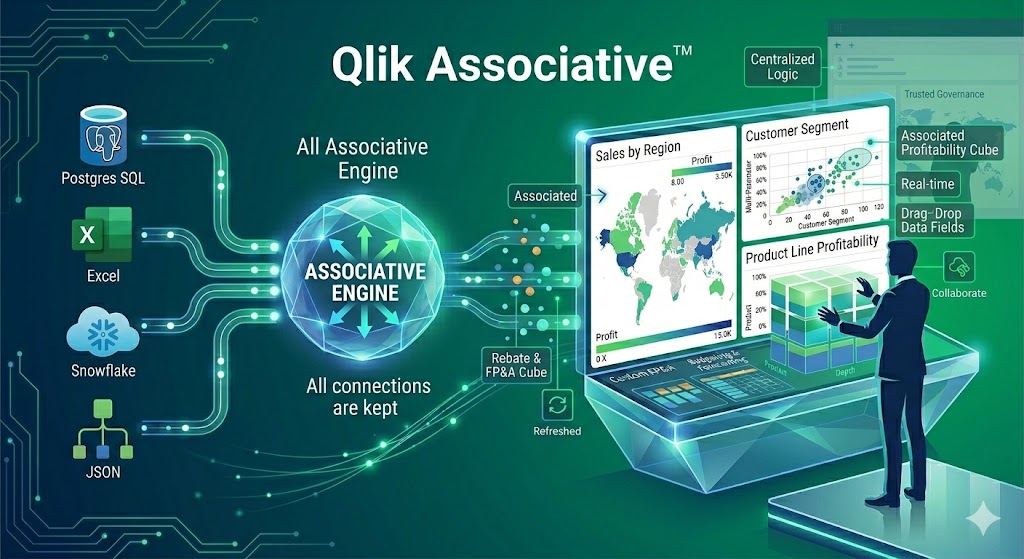
Qlik
Qlik is a pioneer in the business intelligence space, recognized for its powerful, proprietary “Associative Engine” that sets it apart from traditional query-based tools. Instead of forcing users down pre-defined paths or relying on rigid SQL joins that can leave data behind, Qlik’s engine maps every relationship across all data sources simultaneously, allowing users to explore data in any direction and instantly highlighting what data is and is not related to their current selection. The platform handles end-to-end data pipelines through Qlik Sense, combining automated data integration, cloud data warehousing, and real-time AI-powered insights with intuitive drag-and-drop visualizations. By enabling users to uncover unexpected trends and hidden connections that standard linear tools often miss, Qlik actively drives data literacy and enables organizations to make hyper-informed, proactive business decisions.
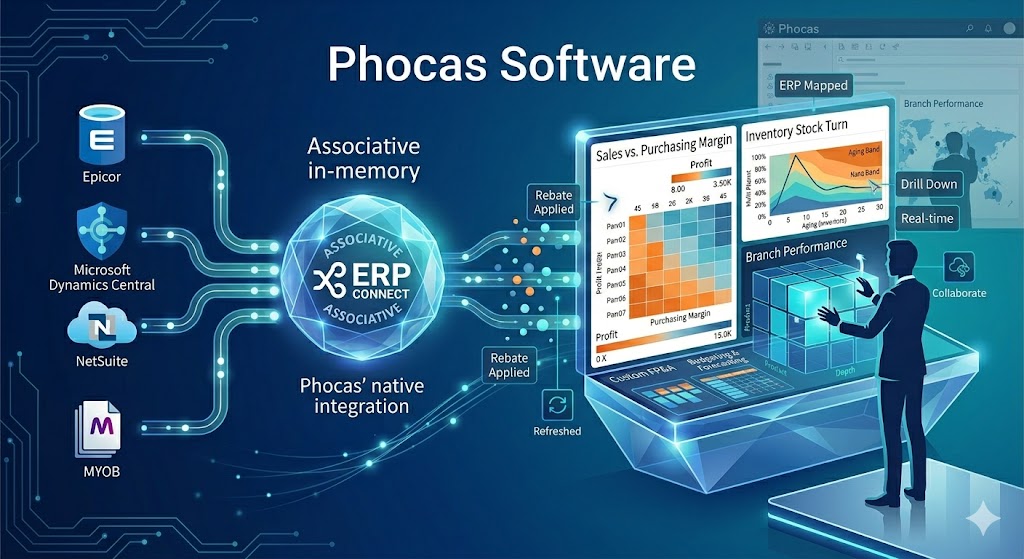
Phocas
Phocas Software stands as an award-winning, world-class SaaS company delivering a comprehensive, all-in-one Business Intelligence (BI) and Financial Planning and Analysis (FP&A) platform. Operating with major divisions across the United Kingdom, North America, and Australia, Phocas supports thousands of customers globally in managing their operational and financial data. The core mission within this ecosystem centers on leveraging Phocas data to empower internal and external stakeholders alike, providing them with the clear, structured insights necessary to make better, more informed business decisions. By turning complex transactional data into highly visual, accessible metrics, the platform bridges the gap between raw database entries and strategic executive planning.
Further expanding the ecosystem are tools that approach data architectural logic from entirely different philosophy tracks, such as Google Looker and Qlik. Google Looker eschews traditional data extraction mechanisms altogether, relying instead on its proprietary, code-governed LookML modeling layer to query cloud data warehouses directly, which ensures a strictly enforced, centralized “single source of truth” across an entire corporation. Qlik separates itself from the pack through its unique, memory-based Associative Engine, which dynamically maps non-linear relationships across all data points simultaneously, exposing hidden trends that standard SQL-based linear joins inherently drop. When stacked against other notable players in the market—such as Domo for rapid, cloud-native executive dashboards, or Sisense for embedding analytics directly into custom software products—it becomes clear that selecting the right BI tool depends entirely on whether a company requires a rapidly deployable, vertically integrated system like Phocas, a visually driven exploration platform like Tableau, or a strictly governed data warehouse model like Looker.